The Best Google Analytics Reports for Improving Websites
Last updated |
Google Analytics isn’t just for knowing how much traffic your website is getting, your top pages, and how your traffic sources are performing. Nope. There is an even better use for it!
It’s also really important to use it to help improve your website – so it converts many more visitors into sales. But unfortunately Google Analytics can be a little daunting at times, particularly with so many reports to analyze. Where should you start for best results?
To help you make sense of this, I’ve created a list of the best Google Analytics reports so you can quickly gain more insights into your website performance and what needs improving most. Let’s get started…
The best Google Analytics reports to improve your website
Check the landing pages report for pages with high bounce rates and low conversion rates
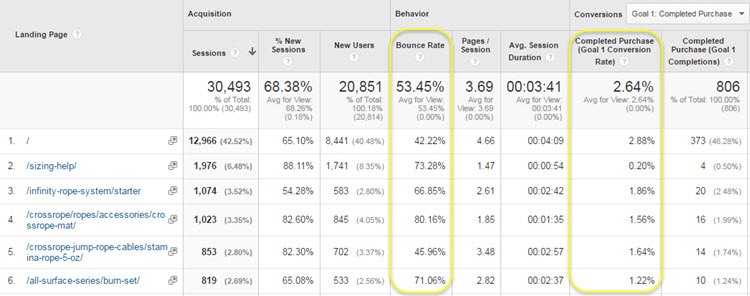
Your top landing pages (entry pages) are crucial to optimize because they are the first pages your visitors see on your website. If visitors don’t find what they are looking for or are confused, they will leave your website often within just 5 seconds!
To improve your website with this report, pull up your landing pages report for the last 30 days (found under ‘Behavior > Site Content > Landing pages’). Then see which pages out of the top 10 have highest bounce rate (over 50% is high) and which have lower than website average goal conversion rate (both indicated below in yellow) – these are indicators of poorly performing pages on your website.
Then optimize these poor page performers first – improving headlines, benefits, imagery and call-to-action buttons are some of the best ways to do this. Optimizing these helps increase visitor engagement and increases the chances of them converting. You should also ensure you show your unique value proposition more prominently on them.
Analyze your Shopping Behaviour report for high-drop off rates
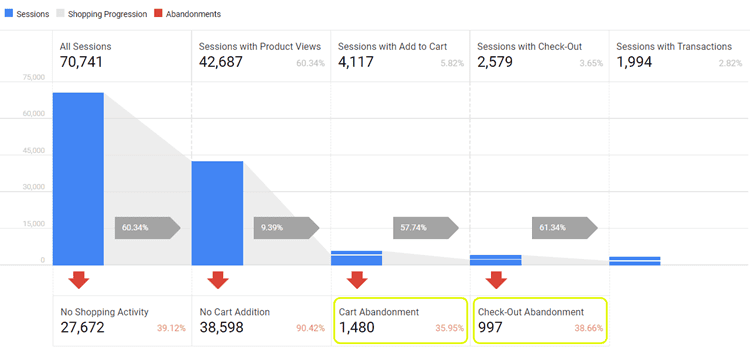
It doesn’t matter how good your website is if visitors struggle to get through your cart and checkout. To understand how well they complete that process, its vital to check your Shopping Behaviour report. On this report (found under ‘Ecommerce’ tab) you can see how many vget through each shopping stage, and which are most problematic. Most importantly you can see your cart abandonment rate (the percentage of people that leave your cart without continuing) and your checkout abandonment rate (those who leave your checkout with purchasing).
You need to pay great attention to any stage with a high drop off rate (more than 60%) and optimize those first. Improving these will greatly increase your conversion rate, and therefore your sales.
 If you have a multi-page checkout, you should also check out the ‘Checkout Behaviour’ report as this gives you even more detail by showing you drop off rates of each page of your checkout, like your billing page.
Check your traffic overview report for poor performing traffic sources
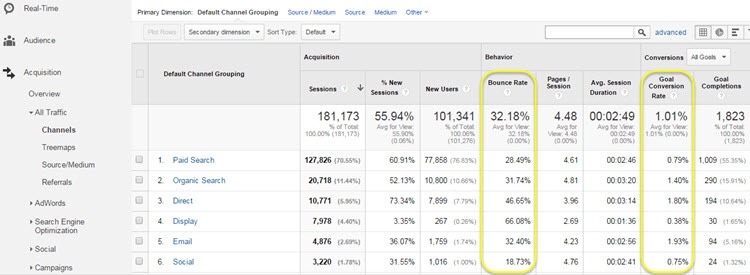
Improving the quality and quantity of your traffic has huge impact on your website conversion rates, and its vital you gain insights into traffic performance and optimize the major sources.
To help you gain greater insights into this, pull up the ‘Channels’ report as Google calls it (found under ‘Acquisition > Channels) and check which of your top 10 traffic sources (channels) have high bounce rates (over 50%), or a goal conversion rate that is much lower than your website average. This is particularly important to do for any source that you are paying for like paid search or display advertising, as you will need to optimize these quickly to reduce your wasted spending.
You should also look for traffic sources that seem low or missing from the top 10 channels. For example, you may find your email traffic source isn’t as high as you had hoped for or isn’t converting well, so you should optimize your email marketing campaigns as soon as possible.
Note: You may even find your email marketing campaigns are not being attributed correctly to the email traffic channel, which can be fixed by using campaign tracking codes for your emails. I highly recommend doing this to monitor the success of your email marketing efforts.
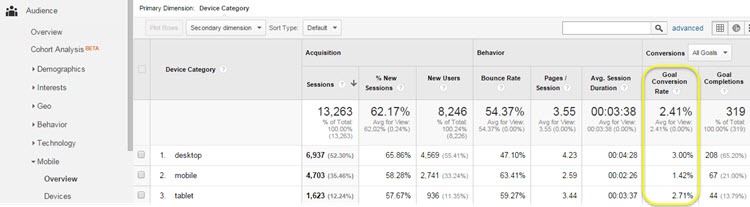
Use the mobile overview report for tablet/mobile insights
Mobile traffic often now accounts for over 50% of total website traffic – and these visitors have very different needs due to smaller screen sizes, and often convert much lower than regular website traffic.
To understand your mobile traffic, and its performance, you need to check your ‘mobile overview’ report (found under Audience > Mobile > Overview). Here you need to see what the conversion rate for each is. If conversion rate is much lower for any, you need to check your website on that device for key issues and fix them immediately – in particular ensure you have a mobile optimized version of your website.
Note that mobile conversion rates are often lower than desktop conversion rates because these visitors are often just browsing when they are not at home and not ready to purchase.
To take this mobile analysis a step further you should also check the ‘Devices’ report and see if there are any types of devices that convert lower, for example maybe your website breaks slightly on older devices that have less width, like the iPhone SE 2019 model.
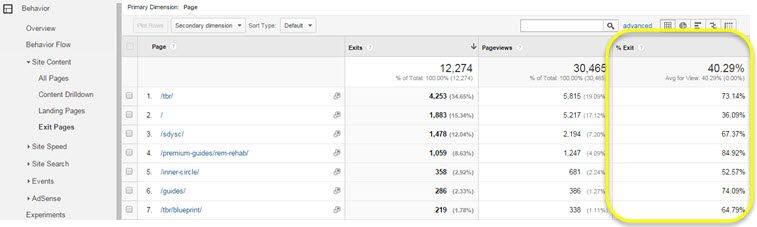
Check the exit pages report to find problematic pages
You also need to find out which pages are most often causing your visitors to leave (called an ‘exit’ page) – and improve and optimize those too.
To find these top exit pages, check your ‘exit pages’ report (found under ‘Behavior > Site Content > Exit Pages). In particular look for any pages that shouldn’t be in the top 10, and try to figure out why so many people exit your site on them. Also look for pages with especially high exit rate (over 50%), as this often indicates problems. I recommend that you also use Hotjar to gain insights into why visitors are leaving on these pages.
A few ways to improve these top exit pages is by using and optimizing call-to-action buttons at the end of them (the wording and style of them in particular), and try using exit intent popups to show a great incentive (discounts/free guides etc) before visitors leave your website.
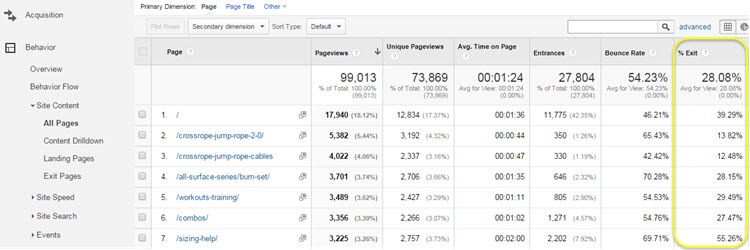
Analyze the top pages report for key missing pages and high exit rates
Your top pages report can contain some real gems for insights – and not just what your top 10 pages currently are. You can find this report under Behavior > Site Content > All Pages.
First check if any of your top pages have high exit rates (over 50%) and optimize those as soon as possible. You should also to check if any pages relating to your key goals seem missing from this report or have low traffic. For example, perhaps few people are visiting your important ‘why us’ or benefits page – making links more prominent to these pages will hopefully drive more traffic to them and increase the sales or leads coming from them.
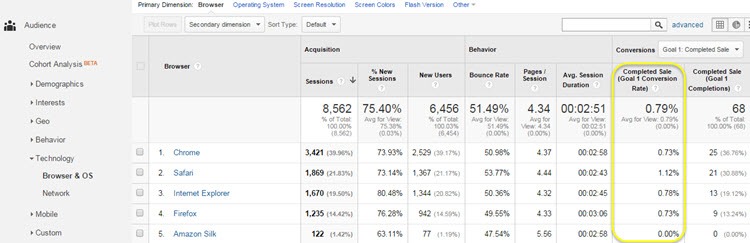
Check the browser report for poor conversion rate performers
Your webpages can sometimes look slightly different or even break in some browsers (often due to small differences in how browsers show CSS code). This can unknowingly cause you many lost sales or leads.
To make sure this isn’t negatively impacting your website, you need to regular check the ‘Browser & OS’ report (found under ‘Audience > Technology) and make sure your conversion rates aren’t much lower for any browsers. If you see ones on this report that are much lower, you should go ahead and check for technical problems like CSS rendering issues and fix them immediately.
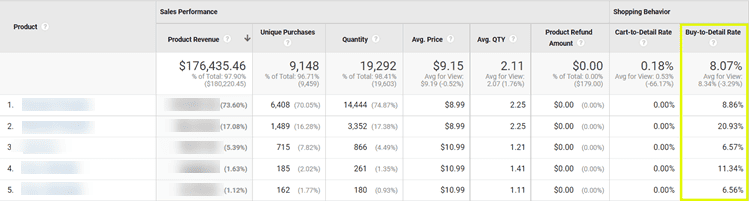
Check your ecommerce product performance report for poor converting products
If you have an ecommerce website it’s essential to see if any of your products are converting worse than others. Once you know which ones are doing worse you can focus optimizing those first. For example maybe one of your top products isn’t converting very well which makes you realize there might be some key information missing on it. To find this open up your ‘Product Performance’ report under the ‘Ecommerce’ tab, and the look for the ‘Buy-to-Detail Rate’ which is really the conversion rate (it’s based on product views divided by purchases).
Need help analysing Google Analytics reports for insights?
If you don’t have time or the skills to gain insights from your Google Analytics reports check out my ‘Google Analytics Insights’ service.